Finlayids 2007: prediction of activity
to the list of predictions
Introduction
Computation characteristics
We'd like to introduce the results of Finlayid meteor stream simulation aimed to the prediction of shower activity in 2007. The simulation was made for the trails of latest 28 revolutions, i.e, from the 1807 trail. The Author used the program by S. Shanov and S. Dubrovsky "Comet's Dust 2.0" to calculate orbital elements of ejected meteor particles. To estimate expected ZHRs for different encounters the model by E. Lyytinen and T. van Flandern given in their paper [4] was used with some Author's alterations made in order to adopt the model for ejection velocity (Vej) instead of da0 (difference in a-semimajor axis) and to convert the model from the Leonid stream (for which it was originally created) to the Finlayids. The computation considered only gravitational forces. The prediction includes all encounters found within interval +/-0.007 a.u. The following parts of trails were computed: the first 15 rev. trails for ejection velocities [-50;100] m/s, 16-28 rev. trails - [-30;50] m/s.
Results
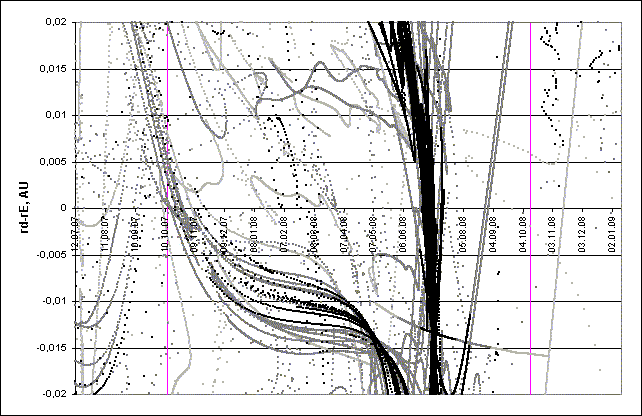
The Fig. 1 below shows the distribution of 15P dust trails in the vicinity of the Earth's orbit within the period of 12.07.2007 - 11.01.2009. The vertical axis shows the minimal distance between trails particles and the Earth's orbit. So far, the Fig. 1 displays the moments of passage of minimal distances to the Earth's orbit for various trails and particles and these distances themselves.

Fig. 1. Space-temporal projection of Finlayid trails parts onto their minimal distance passages (correspondence between colours of the particles and their ejection velocities can be seen here).
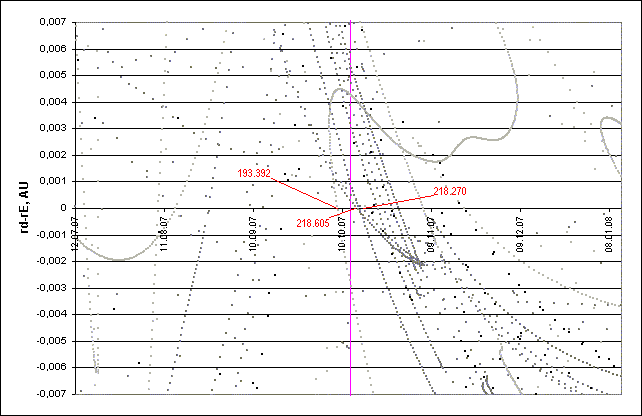
For the year 2007 we can see concentration of trails around the time of minimum distance between the comet and Earth orbit. This part of the Fig. 1 is given on the Fig.2 in more detailed scale. It shows the distribution of 15P dust trails in the vicinity of the Earth's orbit within the period of 12.07.2007 - 12.01.2008. The vertical axis shows the minimal distance between trails particles and the Earth's orbit. So far, the Fig. 2 displays the moments of passage of minimal distances to the Earth's orbit for various trails and particles and these distances themselves. Also, the interesting points of intersection between the Earth's orbit and regular trail parts of the comet 15P are marked with their solar longitudes.

Fig. 2. Space-temporal projection of Draconid trails parts onto their minimal distance passages (correspondence between colours of the particles and their ejection velocities can be seen here).
An encounter between the Earth and vertical trail of 15P are given below in a table .
where trail - year of trail ejection; rD-rE_e - effective distance between the Earth's orbit and trail particles orbits; Vej - velocity of particles ejection on the given trail part (positive values means the particles were ejected against the comet movement, negavive - particles were ejected along the comet movement); fM(fMD) - the characteristic of longitudinal density of the trail, it is derived from the time interval between passages of minimal distance to the Earth's orbit by particles with different ejection velocities; SL - solar longitude corresponding to the maximum; MT - assumed time of maximum.
In the next table we can see parameters of two direct encounters with 1820 trail:
where trail - year of trail ejection; rD-rE - the distance between the Earth's orbit and trail particles orbits (positive value means the descending node of trail is outside the Earth's orbit, negative - the node is inside it); Vej - velocity of particles ejection on the given trail part (positive values means the particles were ejected against the comet movement, negavive - particles were ejected along the comet movement); fM(fMD) - the characteristic of longitudinal density of the trail, it is derived from the time interval between passages of minimal distance to the Earth's orbit by particles with different ejection velocities; SL - solar longitude corresponding to the maximum; MT - assumed time of maximum.
So far there is two possibilities of 15P shower activity in 2007:
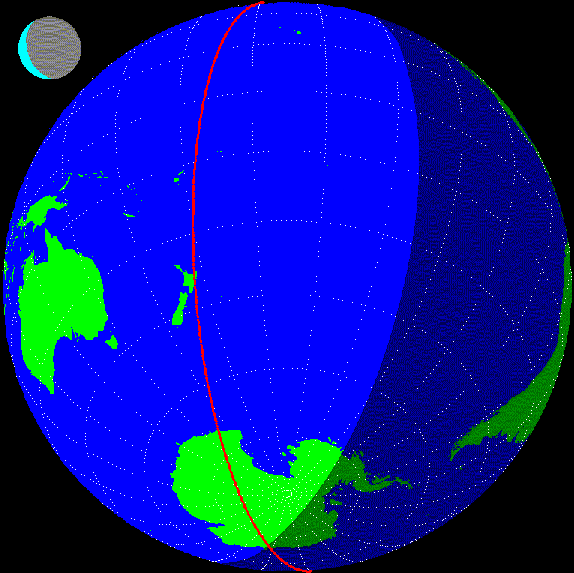
The first is connected with close encounter with vertical 1926 trail at 3:32 UT 7 October. The basic model doesn't show visual activity, primarily due to hugh ejection velocity of trail particles (66.55 m/s), as well as small size of the comet 15P. However, the likelyhood of activity in radiorange is much greater, and, considering that activity from 15P shower hasn't been observed yet, we can't exclude, that meteors will appear also in the visual range. Basic parameters of the encounter are quite good - we have a close encounter with a relatively young trail, which has regular structure, so there are sufficient chances for some kind of activity appearance. Radiant: RA=255.2°, Dec=-42.9°, Vg=10.9 km/s. The Fig. 3 shows the map with regions where this peak would be visible if occured at given time. So far, the best place for observations would be extreme south of South America and some parts of Antarctica. Radioobservations are also possible from New Zealand, eastern part of Australia and most past of Antarctica.
| encounters with "vertical" trails | |||||
| trail | rD-rE_e | Vej | fM(fMD) | SL | MT |
| - | AU | m/s | - | ° | UT |
| 1926 | 0.00016 | 66.55 | 0.722 | 193.392 | 07.10.2007 03:32 |
In the next table we can see parameters of two direct encounters with 1820 trail:
| direct encounters with trails | |||||
| trail | rD-rE | Vej | fM(fMD) | SL | MT |
| - | AU | m/s | - | ° | UT |
| 1820 | -0.00171 | -19.12 | 0.260 | 218.270 | 01.11.2007 04:44 |
| 1820 | -0.00190 | -18.60 | -0.564 | 218.605 | 01.11.2007 12:47 |
So far there is two possibilities of 15P shower activity in 2007:
The first is connected with close encounter with vertical 1926 trail at 3:32 UT 7 October. The basic model doesn't show visual activity, primarily due to hugh ejection velocity of trail particles (66.55 m/s), as well as small size of the comet 15P. However, the likelyhood of activity in radiorange is much greater, and, considering that activity from 15P shower hasn't been observed yet, we can't exclude, that meteors will appear also in the visual range. Basic parameters of the encounter are quite good - we have a close encounter with a relatively young trail, which has regular structure, so there are sufficient chances for some kind of activity appearance. Radiant: RA=255.2°, Dec=-42.9°, Vg=10.9 km/s. The Fig. 3 shows the map with regions where this peak would be visible if occured at given time. So far, the best place for observations would be extreme south of South America and some parts of Antarctica. Radioobservations are also possible from New Zealand, eastern part of Australia and most past of Antarctica.

Fig. 3. The Earth as seen from coming Finlayid meteors during the peak at 3:32 UT 7 October. Red line shows the border of hemisphere where the Moon is above horizon (it is shown with in the corner of the Fig. 3 according to its phase).
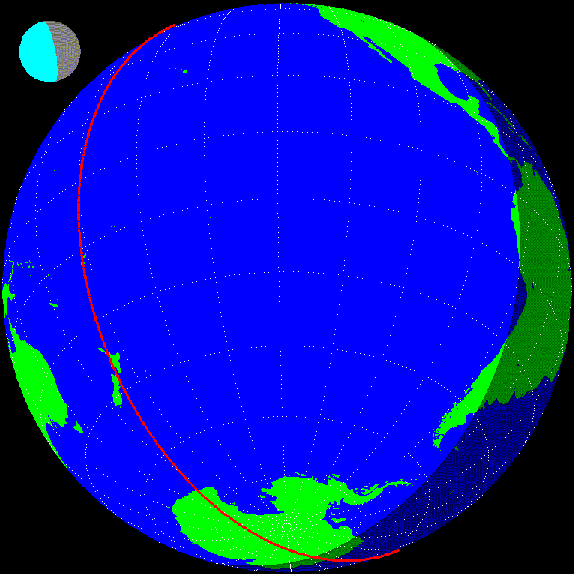
The second is connected with direct encounter with two parts of 1820 trail. This trail is much more old, and the encountered parts have significant negative ejection velocity. So far reliability of this maximum is much lower than that of 1926 trail. However, if it occurs, its meteor brightness should be higher than average. Basic ZHR given by the model is 0.3, but lets don't forget, that calibration of the model is low as we had no chance to check it on observing data on 15P shower (due to their absence). So there could be significant discrepancies in activity from model results. Time of maximum is also very uncertain, it would be better to say that activity is possible on 1 November 2000, more likely in the first half of the day. Radiant: RA=251.6°, Dec=-33.4°, Vg=13.3 km/s. The Figs. 4 and 5 shows the map with regions where this peak would be visible (these figures are given for the befinning and the end of likely period of activity occurance) if occured at given time. We should note that in this case radiant is quite close to the Sun, so visual observation are possible in the thin line of the Earth surface soon after the sunset. So far radiomethods are most suitable for tracking this maximum. Radioobservations in the given period will be possible in Australia, New Zealand, southern South America, most part of Antarctica, in Southern Asia, India and most part of Africa, excludind its north-west.

Fig. 4. The Earth as seen from coming Finlayid meteors at the beginning of possible period of activity from 1820 trail at 0:00 UT 1 November. Red line shows the border of hemisphere where the Moon is above horizon (it is shown with in the corner of the Fig. 4 according to its phase).

Fig. 5. The Earth as seen from coming Finlayid meteors at the end of possible period of activity from 1820 trail at 12:00 UT 1 November. Red line shows the border of hemisphere where the Moon is above horizon (it is shown with in the corner of the Fig. 5 according to its phase).
In 2008, as can be seen on the Fig 1, around the time of Finlayid maximum we have no significant dust clouds close to the Earth's orbit, so we expect no Finlayid activity in that year.
Conclusions
For 2007 "vertical trail" approach shows a weak (but quite reliable) occurance of Finlayid activity from 1926 trail at 3:32 UT 7 October. Computed ZHR for this peak is less than 1, but we have very good chances for radioactivity. The second peak, due to the direct encounter with 1820 trail, can occur on 1 November in the first half of the day. Computed activity is also very low, but meteor brightness should be high. Also, the error in ZHR prediction could be very high, as this shower wasn't observed in past. The Moon won't be a nuisance in both times, but on 1 November the radiant will be quite close to the Sun, so useful observations are possible primarily by using radimethods.
References
1. "Comet's dust 2.0" program by S. Shanov and S. Dubrovsky. [Used for orbital computations.]
2. Information from Gary W. Kronk's page http://www.maa.agleia.de
4. Lyytinen E, van Flandern T. "Predicting the strength of Leonid outbursts", 2000, Icarus, P. 158-160.